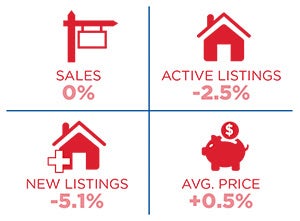
SALES COMMENTARY
While sales have been disappointing, prices have not declined. Aside from the York Region (Richmond Hill), prices are 2%-5% higher than for March of 2018 across all property types. The primary reason is that listings have also declined. Much has been made of the fact that many Realtors cancel and relist a property to give it a ‘fresh look’ and hence we may be overstating ‘new’ listings. So, this makes our argument even stronger when we look at just ‘new’ listings. The importance of ‘new’ listings is that you need to compare sales in a month to ‘new’ listings generated in the same month (flow to flow) as opposed to comparing sales (flow) to ‘active’ listings which is a stock concept. On TREB, the March 2019 ratio of sales-to-new listings was 51%. In March of 2018 it was 47%. A balanced market is in the 40-60% range. The 416 area is currently 56% versus 47% in 905.
In terms of the condo market, we actually saw sales decline in March by 9% from March of 2018. Most of this drop was in the 416 area. Within 416, the weakest area was downtown where sales were 21% lower. In Humber Bay Shores the drop was only 7%. Against these sales figures, you have to examine the sales-to-new listings ratio. Downtown it was 60%. It was 78% in Humber Bay for March. In March of 2018, the corresponding numbers were 74% and 88%. These numbers indicate that we are still in a ‘sellers’ market, even though sales are lower than last year. Prices are thus 5% higher on average from a year ago which supports this view.
SALES TO NEW LISTINGS RATIO
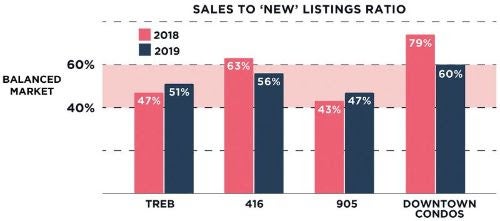
This chart plots the sales-to-new listings ratio (SNLR) for the current year and previous year. A balanced market is between 40% and 60%. When looking at Downtown Condos, we can see that we are still in a ‘sellers’ market.