SALES COMMENTARY

September was another solid month for sales, which clearly confirmed the upward market direction of this market. Sales were 22% higher than for September of last year. But this number is also slightly below the peak September years of 2016 and 2015. We continue to look at Listings as a future indicator. ‘New’ Listings for the month were 2% lower than last year and the current level of ‘Active’ Listings is 14% lower than a year ago. Again, supply is holding back this market. In terms of the condo market, sales in September were 16% higher than September of 2018 and listings were unchanged from a year ago as ‘new’ listings’ for the month were lower than the ‘active’ listings at month’s end which means supply continues to fall.
The end result is higher prices. For a sustainable market, we need prices to increase by approximately 4% per year to maintain a balance and ongoing affordability. Currently, we are running at 5% on average for the overall market. Yes, prices are lower in York Region from a year ago but that is the only area as prices are 7+% higher in Peel and Halton Regions.
The end result is higher prices. For a sustainable market, we need prices to increase by approximately 4% per year to maintain a balance and ongoing affordability. Currently, we are running at 5% on average for the overall market. Yes, prices are lower in York Region from a year ago but that is the only area as prices are 7+% higher in Peel and Halton Regions.
This brings us to a discussion on real estate ‘bubbles’. Outside observers, based on average real estate prices to average incomes, and average real estate prices to average rental prices, over twenty-five years, believe that Toronto is in a ‘bubble’. This argument does not take into account interest rates over this period either. But the real definition of a ‘bubble’ is when demand (buyers) exceeds supply (sellers with listings) which forces prices to rise to much higher levels. For people living in Toronto, the question is not if we are in a bubble but when will it break – i.e. more sellers than buyers. When you look at the population growth and when you look at how quickly developers can bring new housing to market, you quickly realize that we are a long way from a market balance. On an annual basis, we need almost 40,000 new units each year. Over the last ten years, we have never reached this number in a single year. Our advice, we are years away from any serious price correction. Yes, Government intervention may cause a market to slow down for a short period of time (2017) but these are only temporary as the market learns to adjust.
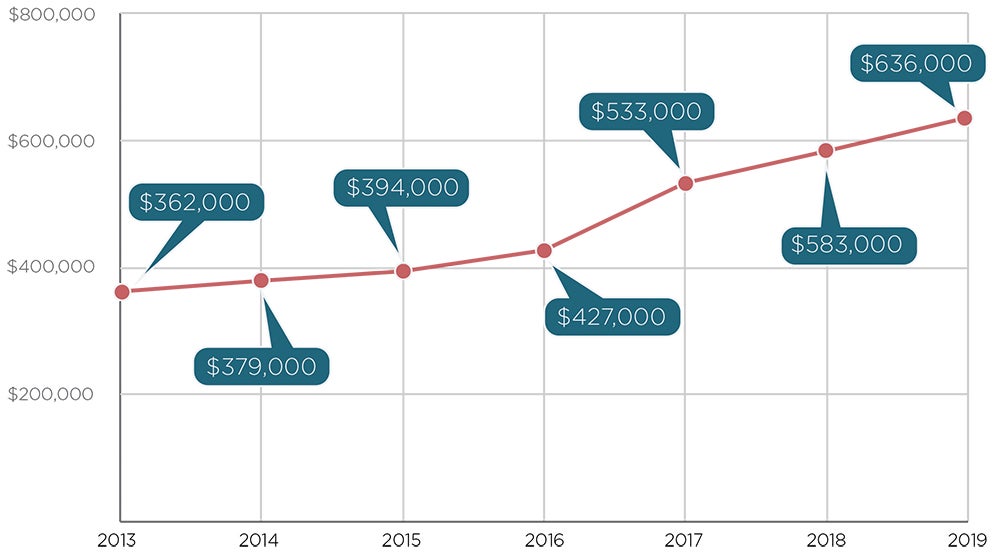
AVERAGE PRICE - CITY OF TORONTO CONDOS
This graph plots the average price of Toronto Condos since 2013. We can see that the average annual increase is 9.7% each year. This has resulted in a narrowing of price differences with the low-rise market and slower sales.
Source: Toronto Real Estate Board
Source: Toronto Real Estate Board