SALES COMMENTARY
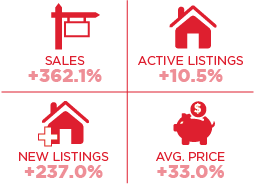 Sales in April on the Toronto Regional Real Estate Board (TRREB) were 13,663 units. That was a decrease of 12.7% from March. Some have suggested that this signifies the start of a market downturn. That is a little premature. April was the second largest sales month ever on the Board. Rather, we are entering a more normal market but still a ‘Sellers Market’.
The direction of a market can always be determined by the listing supply. In April, there were 20,825 ‘new’ listings and the sale to ‘new’ listings ratio was 66%. ‘Active’ listings were less than a one-month supply. Going forward, monthly sales in the 8-10,000 range would be indicative of a normal spring market. If ‘new’ listings stay at current levels, then we will see a slowing of price increases. For the balance of the year, look for 3-5%.
The condo market has now moved back to mirror the overall market in terms of performance. The hardest hit market in 2020 was the Downtown/Humber Bay condo markets. April sales were down by 12% from March. In April, there were 1,757 ‘new’ listings which produced a sales-to ‘new’ listing ratio of 60%. Currently, the ‘active’ listings are at a 35-day supply. This market is still under performing the overall market. The market is mostly impacted by the shortage of vaccines and a weak rental market (foreign students). However, we believe that by September this market will outperform the overall market to the end of the year.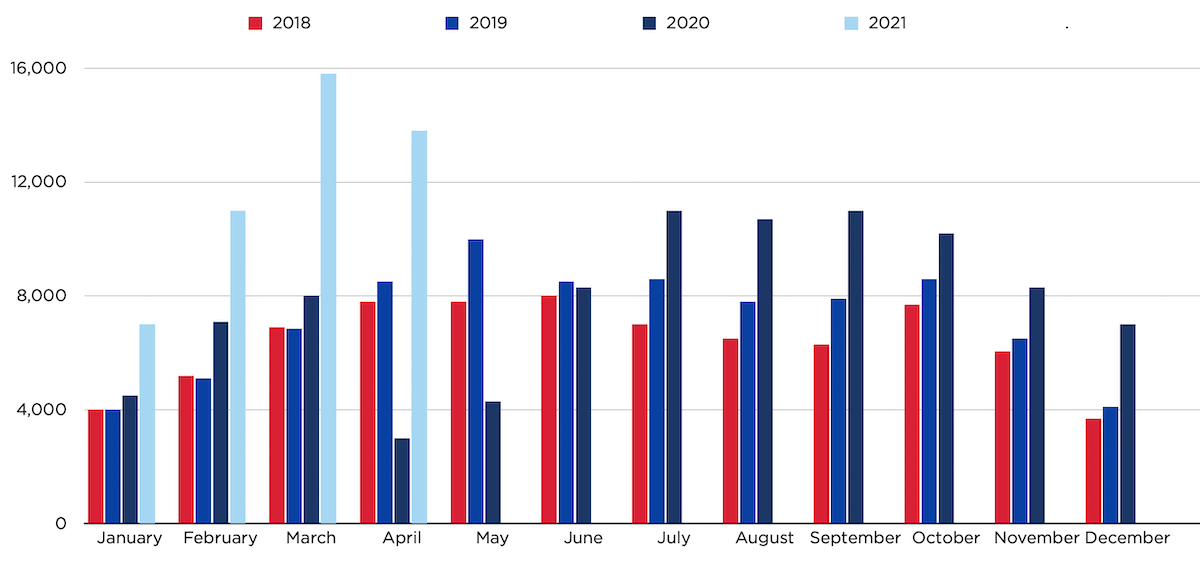 Source: Toronto Real Estate Board
The condo market has now moved back to mirror the overall market in terms of performance. The hardest hit market in 2020 was the Downtown/Humber Bay condo markets. April sales were down by 12% from March. In April, there were 1,757 ‘new’ listings which produced a sales-to ‘new’ listing ratio of 60%. Currently, the ‘active’ listings are at a 35-day supply. This market is still under performing the overall market. The market is mostly impacted by the shortage of vaccines and a weak rental market (foreign students). However, we believe that by September this market will outperform the overall market to the end of the year.
FIGURE 1: TRREB MLS SALES: MONTHLY WITH THREE PREVIOUS YEARS FOR COMPARISON
Source: Toronto Real Estate Board905 VS. 416 CONDO RESALE PRICES
Again, we are not tracking condo prices over several years but want to focus on the price gap between 905 and 416 condo prices. Starting in 2020, we saw that condo buyers had a preference for 905 condos. Prices were cheaper and commute times to work became irrelevant. That meant prices rose faster in the 905 area.We selected the PSV Condos at 4011 Brickstone Mews in the Square One area of Mississauga. This 49-storey condo consists of 592 units and was completed in 2017. We looked only at 2021 sale prices and found 27 sales. The highest price was $835,000 and the lowest was $480,000. Sales ranged from a high of $885 psf to a low of $805 psf.
Next, we looked at 65 Bremner, the second of two towers at Maple Leaf Square. The project consisted of 872 units and was completed in 2010. For 2021, there were only 15 sales. The highest price was $981,000 and the lowest was $520,000. On a per square foot basis, these prices ranged from a high of $1,170 psf to a low of $965.
The price differential between 905 and 416 condo prices has always been about $225 psf. In this example, we can see that this differential has narrowed to $150 psf. Going forward we would expect this differential to go back to previous periods. While 905 condos will not drop in price, 416 condos will appreciate faster over the balance of the year.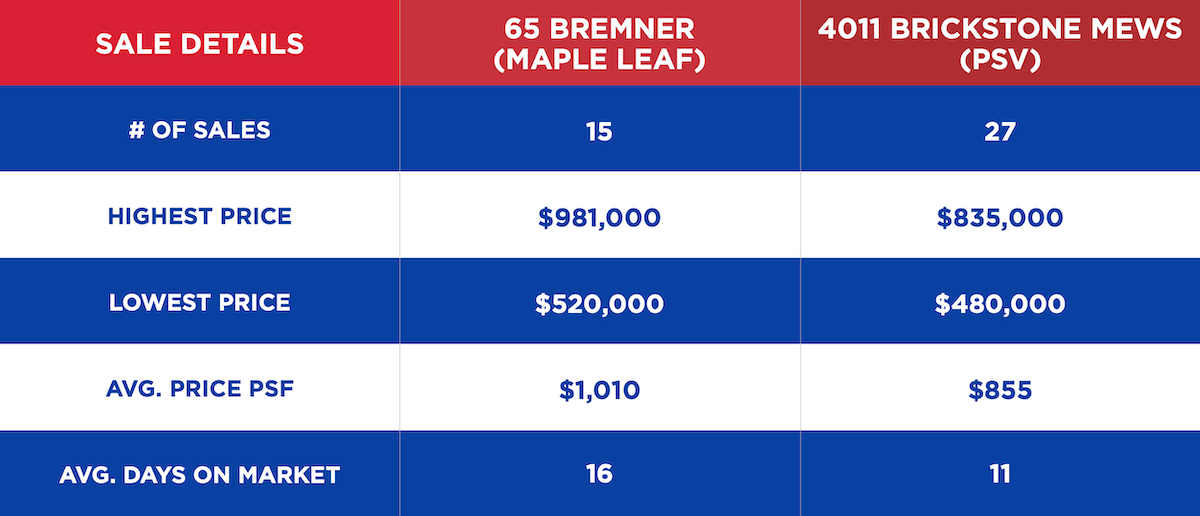 Source: Toronto Real Estate Board
FIGURE 2: 2021 CONDO SALES
Source: Toronto Real Estate Board416 PRE-CONSTRUCTION CONDOS
Further support for rising condo prices in the 416 is that pre-construction/new sale prices in the 1st Quarter of 2021 averaged $1,400 psf. The main reason for rising prices is that construction costs have increased by 30% over the past twelve months and developers are pricing this into their sale prices.RENTAL COMMENTARY
The rental market Downtown/Humber Bay continues to slowly improve for landlords. In April, 2,705 units were leased. The supply of available rentals continues to decline. From April at 3,565, we are down to 3,166 by mid-May.Rents are slowly increasing. For example, studios are now up to $1,550. The one-bedroom market is at $1,770. Investors like to look at rents in terms of a price psf per month. At the peak rents were averaging $4-5 psf. Today studios still show the best returns at $3.85 psf. One -bedroom units are leasing $3.25 psf.